Signs and infographics


Infographic shoudn´t be an article in disguise
Infografika nie je článok v prestrojení
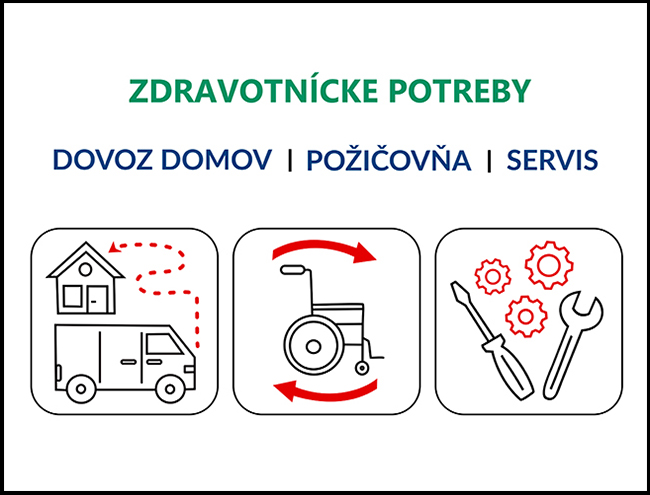
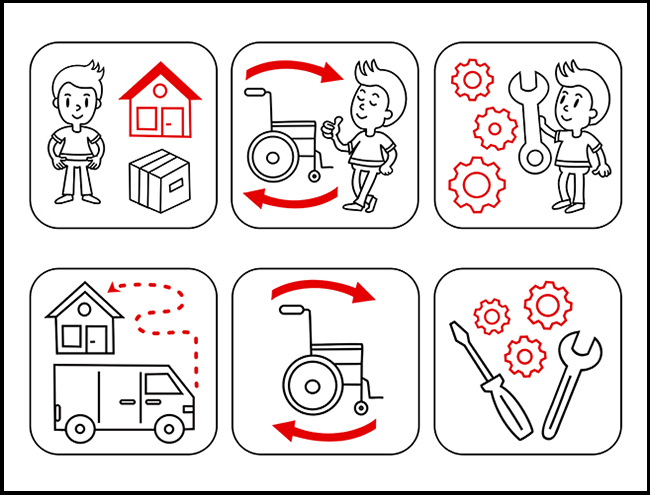
In this day and age, an infographic is widely used to simplify information even in places, where a person doesn´t want to or can´t pay full attention to a graphic design. In order for an infographic to fulfill this task, it should be clear, brief, with minimum text. From a technical point of view, infographic is still an infographic even if it takes forever to scroll down in order to read it (in case of some online infographics). We can find infographics like this on Pinterest and other Social media. However, from a practical standpoint and overal funcionality of a graphic design, it makes little to no sense, because it loses its original purpose – to make a point and provide an information in a clear and easy to understand way.
Well made infographic should show data in a way, that makes a viewer feel engaged and willing to think about its content and topic. Visual aspect of an infographic works best if its in symbiosis with a pragmatic aspect. It gets into a state of symbiosis if it doesn´t distract from to main topic or a message. From this point of view it is important to make sure that graphic elements don´t evoke any unwanted interpretations or that the overal content doesn´t have double meaning. Transitioning from one graphic element to another should feel natural, fluent and cohesive. You can achieve that by choosing a type that is large enough and easy to read. Pay attention to spliting your information into semantically corelated groups or categories. This contributes to how easily and quickly your viewer can memorise and interpret a topic.
The main point or a message should be clear both from the image and text included. Including statistics and facts, if an infographic requires it, has a potential to catch an attention of your viewer, but only if the amount of information doesn´t exceed a reasonable quantity and provided information is easy to remember.
Studies show that people comprehend and remember images more easily than text. We can explain this by understanding the way we think about information. While our brain is processing text in linear order (line by line), we see an image as a whole, thanks to which we get the information from an image quicker. Because infographics often combine both text and image, they have a very significant role in sharing information. Therefore, we definitely shouldn´t underestimate its creation.
In this day and age, an infographic is widely used to simplify informácie i na miestach, kde človek nechce alebo nemôže venovať grafike svoju plnú pozornosť.
Aby infografika tento účel spĺňala, mala by byť prehľadná a stručná s minimom textu.
Z technického hľadiska je infografika infografikou i keď si vyžaduje nekonečné skrolovanie, kým ju dočítate.
Takéto príklady infografiky nájdeme niekedy online, často aj na Pintereste a iných sociálnych sieťach. Z hľadiska praktickosti a funkcionality však takéto typy grafík strácajú svoj zmysel, pretože popierajú ich prvotnú funkciu – stručne a zrozumiteľne sprostredkovať informácie.
Kvalitná infografika by mala zobrazovať dáta tak, aby podnietila diváka vnímať a uvažovať najmä o jej pointe a obsahu.
Vizuálne spracovanie je účinné ak je v symbióze s obsahom. V symbióze je vtedy, ak nezavádza a nedeformuje zdieľané informácie.
Z tohto hľadiska je dôležité uistiť sa, že nevyvoláva nežiadúce interpretácie.
Prechody medzi jednotlivými elementami by mali byť plynulé a bezproblémové. K tomu môže prispieť výber dostatočne veľkého písma aj sémantické oddelenie jednotlivých častí do logických skupín či kategórií. Vytvára sa tým priestor na ľahké a rýchle porovnávanie a zorientovanie sa v danej problematike.
The main point or a message should be clear both from the image and text included. Uvádzanie štatistík a faktov, ak si ich infografika vyžaduje, má potenciál upútať pozornosť diváka, ale len v prípade, že množstvo informácií nepresahuje únosnú mieru.
Studies show that people comprehend and remember images more easily than text. We can explain this by understanding the way we think about information.
While our brain is processing text in linear order (line by line), we see an image as a whole, thanks to which we get the information from an image quicker.
Because infographics often combine both text and image, they have a very significant role in sharing information. Therefore, we definitely shouldn´t underestimate its creation.
author of the text and graphic design: Miroslava Pavlinská
www.miragrafik.sk | webdesign, graphic design and photography
author of the text and graphic design: Miroslava Pavlinská
www.miragrafik.sk | webdesign, graphic design and photography